RSI vs MACD — Which Indicator Is Better for Trading? (Complete Guide)
By HorizonAI Team
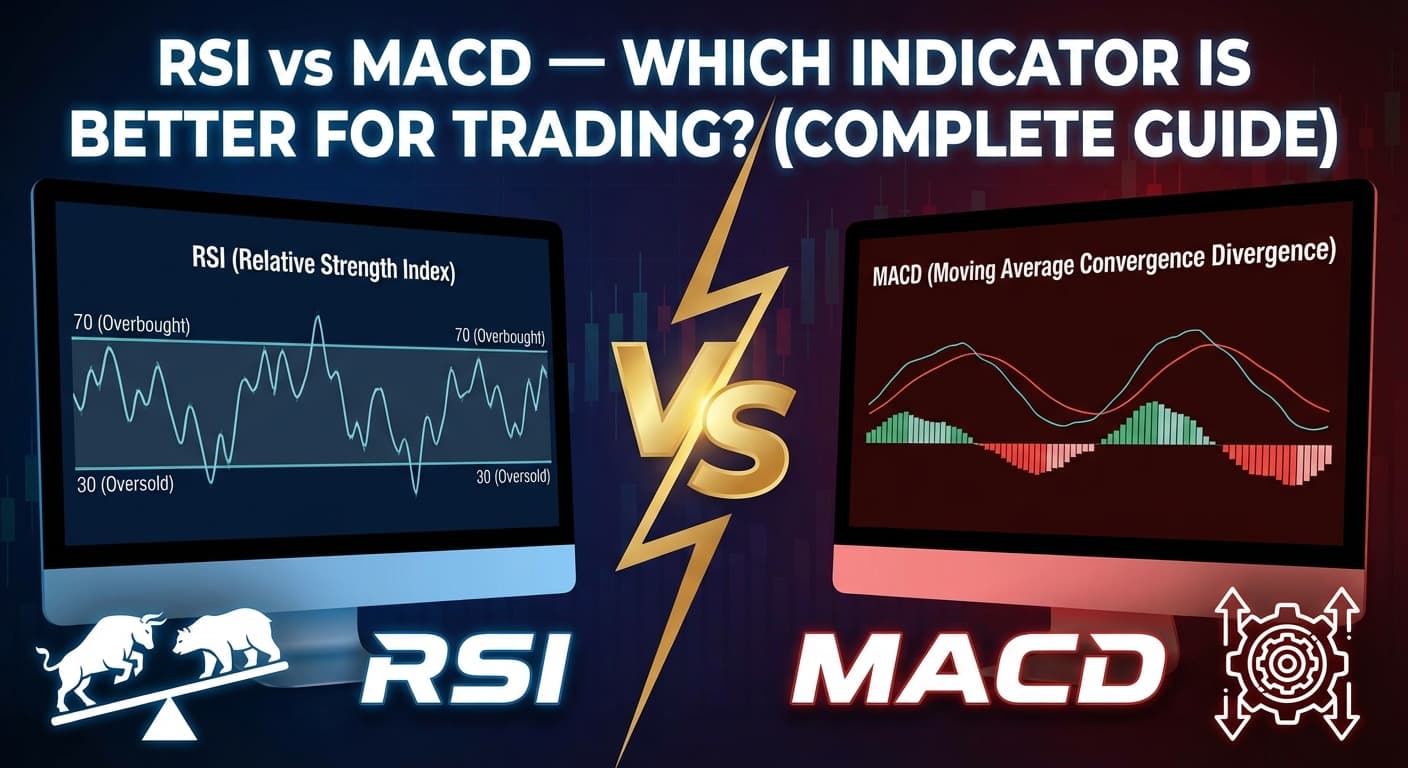
RSI (Relative Strength Index) and MACD (Moving Average Convergence Divergence) are two of the most widely used momentum indicators in trading. Both help identify trend direction and potential reversals, but they work differently and excel in different market conditions.
This guide breaks down when to use each one, with code examples you can use today.
What is RSI?
The Relative Strength Index (RSI) is a momentum oscillator that measures the speed and magnitude of recent price changes. It oscillates between 0 and 100.
Key levels:
- Overbought: RSI above 70 suggests the asset may be overvalued
- Oversold: RSI below 30 suggests the asset may be undervalued
- Default period: 14 candles
RSI is a bounded oscillator, meaning it always stays within a fixed range. This makes it particularly useful for identifying extreme conditions.
//@version=6
indicator("RSI Example", overlay=false)

rsiValue = ta.rsi(close, 14)
plot(rsiValue, "RSI", color=color.purple)

hline(70, "Overbought", color=color.red)
hline(30, "Oversold", color=color.green)

isOverbought = rsiValue > 70
isOversold = rsiValue < 30

bgcolor(isOverbought ? color.new(color.red, 90) : na)
bgcolor(isOversold ? color.new(color.green, 90) : na)
What is MACD?
The Moving Average Convergence Divergence (MACD) measures the relationship between two exponential moving averages (EMAs). It consists of three components:
- MACD Line: 12-period EMA minus 26-period EMA
- Signal Line: 9-period EMA of the MACD line
- Histogram: Difference between MACD and Signal line
MACD is unbounded, meaning it can theoretically reach any value. It's better for identifying trend direction and momentum shifts.
//@version=6
indicator("MACD Example", overlay=false)

[macdLine, signalLine, histogram] = ta.macd(close, 12, 26, 9)

plot(macdLine, "MACD", color=color.blue)
plot(signalLine, "Signal", color=color.red)
plot(histogram, "Histogram", style=plot.style_histogram, color=histogram >= 0 ? color.green : color.red)

bullishCross = ta.crossover(macdLine, signalLine)
bearishCross = ta.crossunder(macdLine, signalLine)

plotshape(bullishCross, style=shape.triangleup, location=location.bottom, color=color.green)
plotshape(bearishCross, style=shape.triangledown, location=location.top, color=color.red)
RSI vs MACD: Key Differences
RSI:
- Type: Bounded oscillator (0-100)
- Best for: Overbought/oversold levels
- Signal type: Level-based (70/30)
- Lag: Less lag, faster signals
- False signals: More common in trending markets
- Divergence: Excellent for spotting
MACD:
- Type: Unbounded oscillator
- Best for: Trend direction & momentum
- Signal type: Crossover-based
- Lag: More lag, smoother signals
- False signals: More common in ranging markets
- Divergence: Good for spotting
When to Use RSI
RSI performs best in ranging or sideways markets where price oscillates between support and resistance levels.
Use RSI when:
- Markets are consolidating or range-bound
- You want to identify overbought/oversold extremes
- Looking for divergence signals (price makes new high, RSI doesn't)
- Trading mean-reversion strategies
- You need faster, more responsive signals
Pro tip: In strong trends, RSI can stay overbought or oversold for extended periods. Don't blindly sell just because RSI hits 70 in an uptrend. Learn more about mean reversion trading strategies that use RSI effectively.
When to Use MACD
MACD excels in trending markets where you want to ride momentum and catch trend reversals.
Use MACD when:
- Markets are trending strongly
- You want confirmation of trend direction
- Looking for momentum shifts via crossovers
- Trading breakout or trend-following strategies
- You prefer fewer, more reliable signals
Pro tip: MACD crossovers in ranging markets can produce many false signals. Wait for price to break out of the range before trusting MACD signals. For trending strategies, see our trend following strategy guide.
Combining RSI and MACD
Many traders use both indicators together for stronger confirmation. Here's a powerful combination strategy:
Bullish Setup:
- RSI crosses above 30 (leaving oversold)
- MACD line crosses above signal line
- Price breaks above recent resistance
Bearish Setup:
- RSI crosses below 70 (leaving overbought)
- MACD line crosses below signal line
- Price breaks below recent support
//@version=6
strategy("RSI + MACD Combined", overlay=true)

// Indicators
rsiValue = ta.rsi(close, 14)
[macdLine, signalLine, hist] = ta.macd(close, 12, 26, 9)
atr = ta.atr(14)

// Bullish: RSI leaving oversold + MACD bullish cross
bullishSignal = ta.crossover(rsiValue, 30) and ta.crossover(macdLine, signalLine)

// Bearish: RSI leaving overbought + MACD bearish cross
bearishSignal = ta.crossunder(rsiValue, 70) and ta.crossunder(macdLine, signalLine)

if bullishSignal
    strategy.entry("Long", strategy.long)
    strategy.exit("Exit Long", "Long", stop=close - atr * 2, limit=close + atr * 4)

if bearishSignal
    strategy.entry("Short", strategy.short)
    strategy.exit("Exit Short", "Short", stop=close + atr * 2, limit=close - atr * 4)
Which Indicator Should You Choose?
Choose RSI if:
- You trade ranging markets or mean-reversion strategies
- You want clear overbought/oversold levels
- You prefer faster signals with defined boundaries
- You're a beginner (RSI is simpler to interpret)
Choose MACD if:
- You trade trending markets or momentum strategies
- You want trend direction confirmation
- You prefer crossover-based signals
- You're comfortable with more nuanced interpretation
Choose both if:
- You want stronger signal confirmation
- You trade multiple market conditions
- You're building a systematic strategy that needs filtering
Building RSI and MACD Strategies with HorizonAI
You can quickly build and backtest RSI, MACD, or combined strategies using HorizonAI:
- Create a new script and select Pine Script or MT5
- Describe your strategy: "Create an RSI oversold bounce strategy with MACD confirmation"
- Iterate: "Add a stop loss at recent swing low" or "Only take signals when RSI divergence is present"
- Backtest: Copy to TradingView and run in Strategy Tester
Example prompts:
- "Build a strategy that goes long when RSI crosses above 30 and MACD histogram turns positive"
- "Create an indicator that alerts when RSI divergence appears with MACD confirmation"
- "Add ATR-based stop loss to my RSI strategy"
New to Pine Script? Check out our Pine Script tutorial for beginners. Then learn how to backtest your strategy properly.
Try it free →FAQs
Is RSI or MACD more accurate?
Neither is inherently more accurate—they measure different things. RSI is better for overbought/oversold conditions; MACD is better for trend direction. Accuracy depends on matching the indicator to market conditions.
Can I use RSI and MACD together?
Yes, combining them can reduce false signals. Use RSI for entry timing and MACD for trend confirmation, or require both to agree before taking a trade.
What timeframe works best for RSI and MACD?
Both work on any timeframe, but higher timeframes (4H, Daily) produce more reliable signals with less noise. For day trading, 15-minute to 1-hour charts are common.
Should I change the default settings?
The defaults (RSI 14, MACD 12/26/9) work well for most situations. Shorter periods = more signals but more noise. Longer periods = fewer signals but more reliable. Test changes with backtesting before trading live.
Summary
- RSI: Best for ranging markets, overbought/oversold levels, faster signals
- MACD: Best for trending markets, trend confirmation, crossover signals
- Combined: Provides stronger confirmation, reduces false signals
- Key: Match the indicator to current market conditions for best results
Both indicators are powerful tools in your trading arsenal. The "best" one depends entirely on your strategy, timeframe, and market conditions.
Related Articles
Continue learning about trading indicators and strategies:
- EMA vs SMA Comparison — Choose the right moving average
- Best Indicators for Day Trading — Top indicators ranked
- ATR Indicator Explained — Measure volatility for better stops
- Bollinger Bands Trading Strategy — Combine with RSI for powerful setups
- Mean Reversion Trading Strategies — Use RSI effectively
- Trend Following Strategy Guide — Leverage MACD for trends
- Combining SMC with Indicators — Mix technical and SMC
- Pine Script Tutorial for Beginners — Code your own indicators
- How to Backtest a Trading Strategy — Validate your approach
Have questions about RSI vs MACD? Join our Discord to discuss with other traders!